Polar
Coordinates and Graphs
To graph equations we have been using the Cartesian rectangular coordinate system
Now we introduce the use of the polar coordinate system
See Example 1, page 614, of the textbook
Polar Form –
Rectangular Form Conversion
Sometimes it it easier to draw the graph of an equation
when the equation is written using the coordinates of
another coordinate system
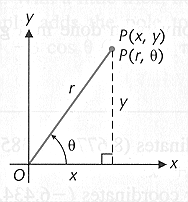
The conversion equations between polar coordinates  and
rectangular coordinates
  are
are

 or
or

 or
or

 or
or 
The signs of  and
and  determine in which quadrant is the terminal side of the angle
By convention, The angle

is chosen so that
 (radians)
or
 (degrees).
See Examples 2 – 4, pages 615 – 617,
of the textbook
Graphing
Polar Equations
The graph of an equation written in polar coordinates
is the set of all the points in the polar coordinate plane
that satisfy the polar equation
For example, following is the graph of the polar equation
 with
with  in radian measure
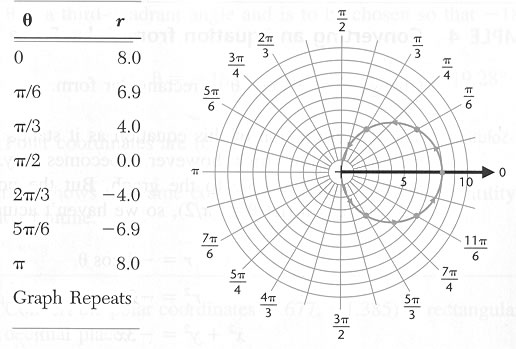
Transforming to Cartesian rectangular coordinates, the equation of the graph is

which is a circle with center at (4,0) and radius 4
Point-by-Point
Plotting
Make a table of values that satisfy the equation
Plot these points
Join the plotted with a smooth curve
See Example 5, page s 617 – 618, of the textbook
Rapid
Polar Sketching
If the polar equation involves only sines or cosines and only a rough sketch is
required,
we can use how these functions numerically vary to sketch the graph relatively
quickly
The sine and the cosine functions both continuously vary from -1 to +1
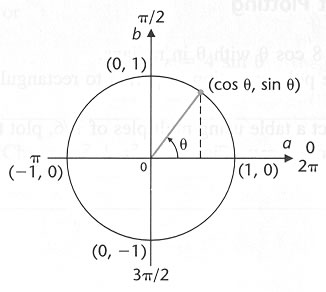
See Examples 6 – 7, pages 619 – 620,
of the textbook
Using a Graphing Utility – see Example 8,
page 621, of the textbook
Standard
Polar Graphs


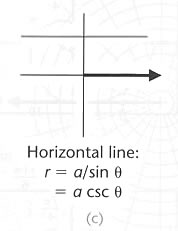


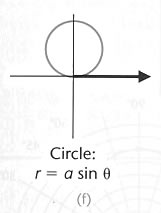
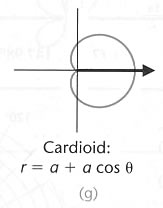

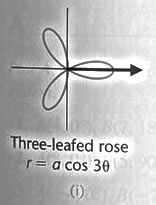

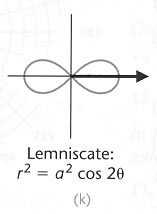

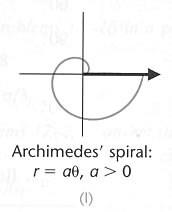
In rectangular coordinates the graph of  is a vertical line
the
graph of  is
a horizontal line
These are simple equations
In polar coordinates the equations of straight lines are not always so simple
Look at graphs (a) – (c) above
The graph of a circle can have a simple equation in polar coordinates
Look at graph (d) above
top
next Complex
Numbers in Rectangular and Polar Forms


